Introduction
In the world of Java application development, the Java Virtual Machine (JVM) is the engine that drives everything. Yet, it often remains a “black box” to many developers. We tend to rely on default settings until something goes wrong—an application slows down, latency spikes, or the dreaded OutOfMemoryError crashes the system. Think of the JVM as a bustling city with complex infrastructure. Without proper management, this city can become congested, inefficient, and prone to outages. But with the right tuning strategies, you can transform it into a well-oiled machine that handles traffic (requests) smoothly, manages resources efficiently, and provides a pleasant experience for its inhabitants (users).
This post consolidates deep-dive notes on JVM internal architecture, memory management, and practical tuning strategies to help you move from “it works” to “it performs.”
JVM tuning is the process of adjusting the JVM’s configuration parameters to ensure your application uses CPU and memory efficiently, especially concerning garbage collection (GC), thread scheduling, and Just-In-Time (JIT) compilation.
In the world of enterprise applications, performance isn’t just a feature—it’s a necessity. When your Java application slows down or crashes unexpectedly, the culprit is often lurking in the depths of the Java Virtual Machine (JVM). Welcome to the fascinating world of JVM tuning, where we’ll explore how to optimize your applications for peak performance, stability, and resource efficiency.
The Architecture of the JVM: Understanding the Foundation
Before we dive into tuning, let’s explore the architecture of the JVM—the foundation upon which all Java applications run.
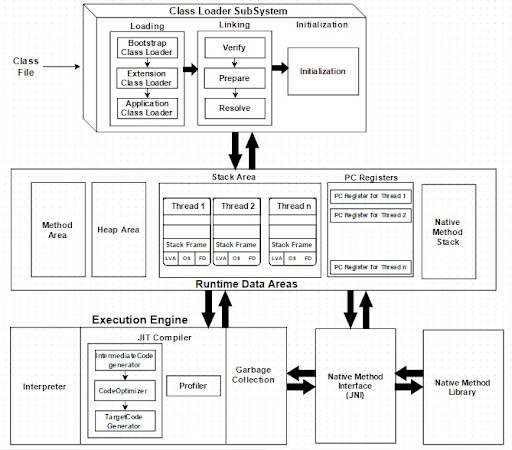
The Class Loader Subsystem: The City's Immigration Department
The Class Loader subsystem is like the immigration department of our JVM city. It’s responsible for loading class files from storage into memory so they can be executed. This process follows three key phases:
- Loading: Finding and loading .class files into JVM memory (Method Area)
- Linking: Making the class ready to run through verification, preparation, and resolution
- Initialization: Assigning real values to static variables and executing static blocks
The Class Loader follows a hierarchical delegation model:
- Bootstrap Class Loader: The top-level authority that loads core Java classes
- Extension Class Loader: Loads JDK extension libraries
- Application Class Loader: Loads your application’s classes from the classpath
Runtime Data Areas: The City's Districts
The JVM divides its memory into different areas, much like a city has different districts for various purposes:
- Method Area: A shared library containing class “blueprints” with structures, method code, and static variables. Since JDK 8, this has been replaced by Metaspace.
- Heap Area: The bustling downtown where all objects and arrays are created. This is the largest memory area in the JVM and is shared by all threads.
- Stack Area: Personal workspaces for each thread, containing stack frames that manage method execution.
- PC (Program Counter) Registers: Personal bookmarks for each thread, indicating the next instruction to execute.
The Execution Engine: The City's Power Plant
The Execution Engine is the heart of the JVM, taking bytecode and executing it. It consists of:
- Interpreter: Reads and executes bytecode one instruction at a time—fast to start but slower for repetitive tasks.
- JIT (Just-In-Time) Compiler: The performance booster that compiles frequently used bytecode into native machine code. It identifies “hotspots” (code that runs frequently) and optimizes them for faster execution.
- Garbage Collection (GC): The automatic memory manager that tracks objects in the Heap and removes those no longer in use.
- JNI (Java Native Interface): A bridge allowing Java code to communicate with code written in other languages like C or C++.
Why JVM Tuning Matters: The Impact on Real-World Systems
Tuning the JVM is like optimizing traffic flow in our city—it directly impacts performance, stability, and resource utilization. Here’s why it matters:
Performance Benefits
- Reduced Latency: Optimizing GC configuration minimizes “stop-the-world” pauses, which can cause unacceptable delays in time-sensitive systems like trading platforms.
- Increased Throughput: Proper heap sizing and GC selection ensure your application spends more time executing business logic rather than managing memory.
- Faster Startup Time: In microservices environments, tuning can influence how quickly applications become fully operational.
Stability Improvements
- Preventing OutOfMemoryError: Correctly sizing memory spaces prevents crashes due to running out of memory.
- Minimizing GC Thrashing: If the heap is too small, the garbage collector may run constantly, consuming excessive CPU resources.
- Stable Resource Consumption: Tuning ensures predictable and consistent CPU and memory usage, vital for service level agreements.
Resource Efficiency
- Lower Infrastructure Costs: An optimized JVM requires less CPU and memory to handle the same workload, reducing cloud computing costs.
- Efficient CPU Usage: Selecting the right garbage collector ensures CPU cycles are used effectively for the application rather than inefficient memory management.
Java Memory Management: The City's Waste Management System
Java’s automatic memory management is one of its greatest strengths, freeing developers from manual memory allocation and deallocation. However, understanding how it works is crucial for effective tuning.
Types of Memory in Java
Java memory is divided into two main categories:
- Heap Memory: Where all objects and arrays are created
- Young Generation: Where new objects are allocated
- Old Generation: Where long-lived objects eventually reside
- Non-Heap Memory:
- Metaspace (replacing the old Permanent Generation): Stores class metadata, methods, constants, and annotations
The Garbage Collection Process
All garbage collectors perform two fundamental steps:
- Marking: Identifying which objects are still in use
- Sweeping: Reclaiming memory from unused objects
However, the implementation varies between different collectors. Some perform compaction (moving live objects together to eliminate fragmentation), while others use copying algorithms.
When Does Garbage Collection Occur?
Contrary to what some developers believe, calling System.gc() doesn’t guarantee garbage collection—it merely suggests to the JVM that it might be a good time. The JVM makes the final decision based on memory pressure and other factors.
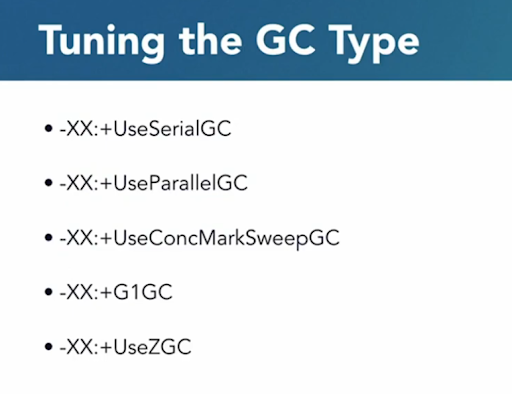
Exploring Different Garbage Collectors: Choosing the Right Waste Management Strategy
Java offers several garbage collectors, each with different tradeoffs between throughput, latency, and pause time.
Serial GC
The simplest collector, suitable for small applications with low memory requirements. It performs all garbage collection work using a single thread, causing “stop-the-world” pauses.
CMS (Concurrent Mark Sweep)
Designed to minimize pause times by performing most of its work concurrently with the application. However, it was deprecated in JDK 9 and removed in JDK 14 due to fragmentation issues and complex tuning requirements.
G1GC (Garbage First)
The default in modern JDKs, G1GC divides the heap into regions and prioritizes collecting those with the most garbage first. It aims to balance throughput and latency with more predictable pause times.
ZGC
A low-latency collector designed for applications with large heaps (multi-terabyte) that require pause times of no more than a few milliseconds. ZGC uses colored pointers to track object states without additional side data, making marking and relocation fast and concurrent.
Metrics for Garbage Collection: Measuring Performance
To effectively tune your JVM, you need to monitor key metrics:
- Allocation Rate: How quickly your application creates objects
- Heap Population: The amount of live objects on the heap
- Mutation Rate: How often references are updated in memory
- Object Lifespan: How long objects typically live
- Mark Time: How long it takes for the GC to identify live objects
- Compaction Time: How long it takes to free up space and reallocate objects
- GC Cycle Time: The duration of a complete garbage collection round
JVM Tuning: The Art of Optimization
JVM tuning should typically be the last step to improve application performance, after code optimization and architectural improvements. When tuning, consider these key questions:
- Is the memory functioning properly? (Neither too much free heap nor too little)
- Is the latency or responsiveness acceptable for your use case?
- Is the throughput meeting your requirements?
Key Parameters to Tune
- Heap Memory:
- Xms<size>: Initial heap size
- Xmx<size>: Maximum heap size
- Example: Xms512m -Xmx2g
- Garbage Collector Selection:
- XX:+UseG1GC: Use G1 Garbage Collector
- XX:+UseZGC: Use Z Garbage Collector (64-bit only)
- Thread Tuning:
- XX:ParallelGCThreads=<n>: Number of GC worker threads
- XX:ConcGCThreads=<n>: Number of concurrent GC threads
- XX:CICompilerCount=<n>: Number of JIT compiler threads
- JIT Compiler Optimization:
- XX:+TieredCompilation: Enable tiered compilation
- XX:CompileThreshold=10000: Set compilation threshold
- Metaspace:
- -XX:MetaspaceSize=256m
- XX:MaxMetaspaceSize=512m
- Heap Memory:
Identifying Memory Leaks: The Silent Performance Killer
Memory leaks occur when objects accumulate in memory that are no longer needed but aren’t being garbage collected. This can slow down your application and eventually lead to OutOfMemoryError.
Symptoms of Memory Leaks
- Application slows down over time and needs frequent restarts
- Increasing memory usage without a corresponding increase in workload
- OutOfMemoryError exceptions
Detecting Memory Leaks
- Monitor Heap Memory: Watch for continuous growth in heap usage
- Inspect GC Activity: Look for decreasing efficiency over time
- Analyze Heap Dumps: Use tools to examine object references and identify leaks
To generate a heap dump when an OutOfMemoryError occurs, use:
					XX:+HeapDumpOnOutOfMemoryError
XX:HeapDumpPath=/path/to/heap_dump
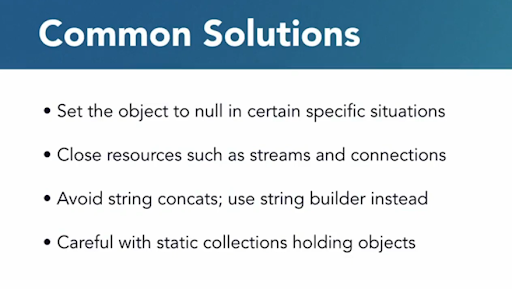
Resolving Memory Leaks
The hardest part is finding where the leak is occurring. Tools like VisualVM, JProfiler, or Eclipse MAT can help analyze heap dumps and identify objects that are being retained unnecessarily.
Conclusion: Building a High-Performance Java Application
JVM tuning requires understanding of the underlying architecture, careful measurement, and iterative optimization. By following the principles outlined in this guide, you can transform your Java applications from sluggish resource hogs into efficient, responsive systems.
Remember that tuning should be approached methodically:
- Establish baseline performance metrics
- Identify bottlenecks through monitoring
- Make targeted changes to JVM parameters
- Measure the impact of changes
- Repeat until performance goals are met
With the right approach to JVM tuning, you can ensure your applications deliver the performance, stability, and efficiency that modern users expect. Happy tuning!